What is Beszel?
Beszel is a lightweight server monitoring platform that includes Docker statistics, historical data, and alert functions.
It has a friendly web interface, simple configuration, and is ready to use out of the box. It supports automatic backup, multi-user, OAuth authentication, and API access.




Features
- Lightweight: Smaller and less resource-intensive than leading solutions.
- Simple: Easy setup with little manual configuration required.
- Alerts: Configurable alerts for most metrics. Supports many notification services.
- Docker stats: Tracks CPU, memory, and network usage history for each container.
- Network monitoring: Monitor response time and interruptions directly from agents.
- S.M.A.R.T.: Disk health data and notifications on drive failure.
- Multi-user: Users manage their own systems. Admins can share systems across users.
- OAuth / OIDC: Supports many OAuth2 providers. Password auth can be disabled.
- Automatic backups: Save to and restore from disk or S3-compatible storage.
Architecture
Beszel consists of two main components: the hub and the agent.
- Hub: A web application built on PocketBase that provides a dashboard for viewing and managing connected systems.
- Agent: Runs on each system you want to monitor and communicates system metrics to the hub.
Screenshots
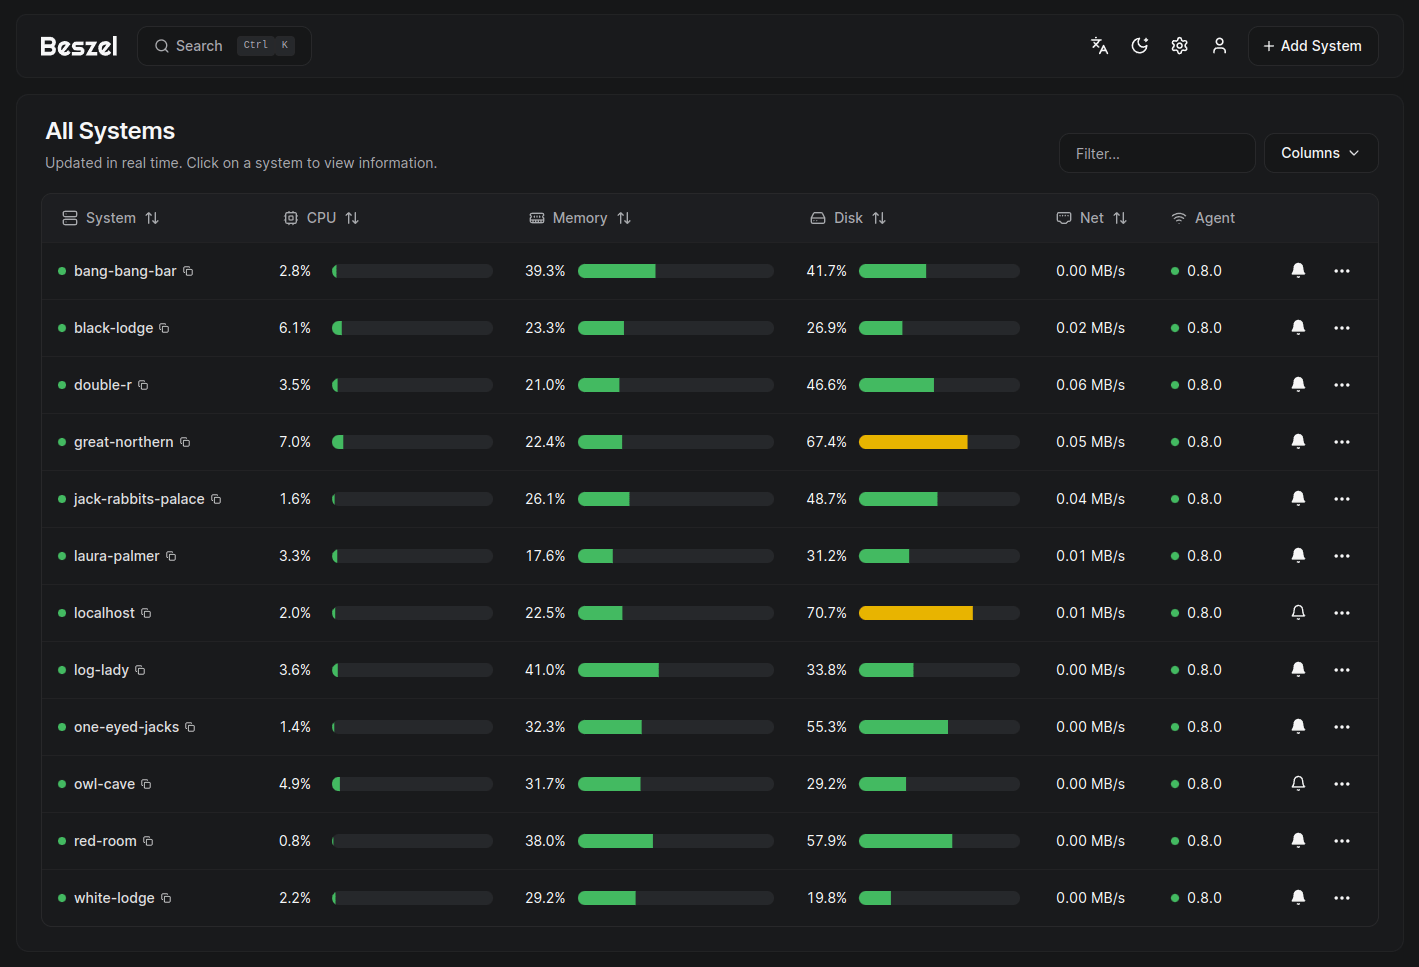
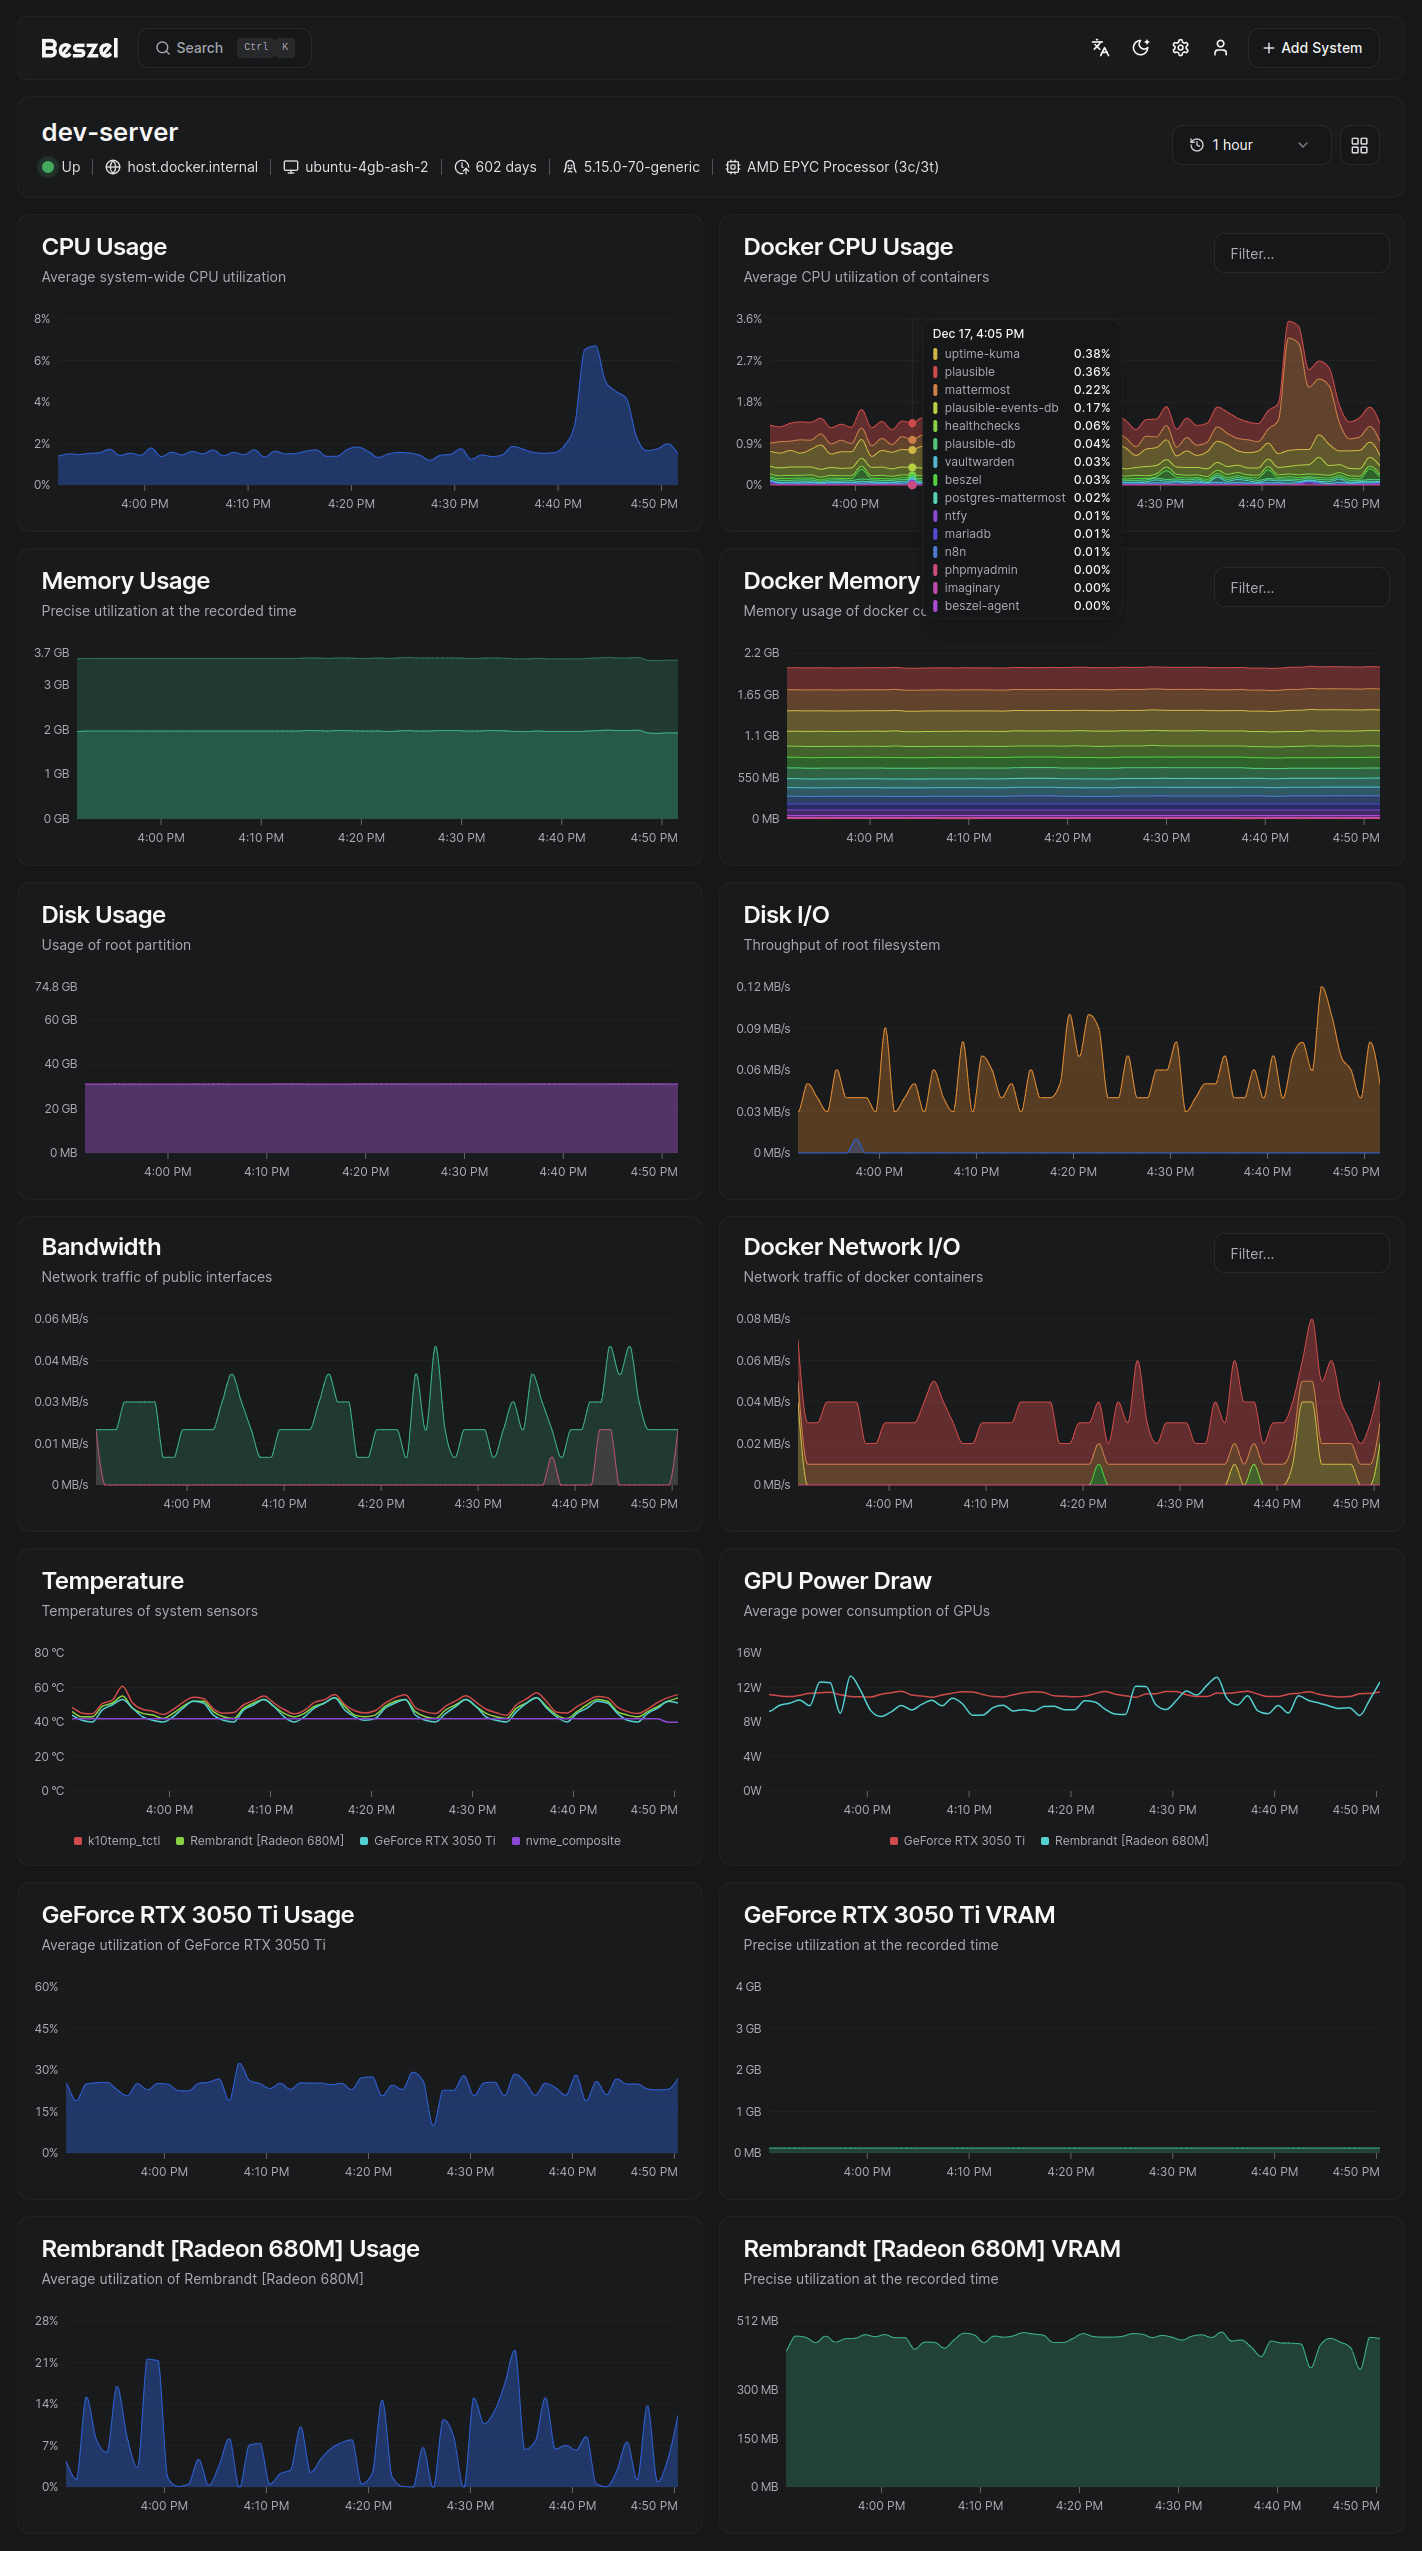
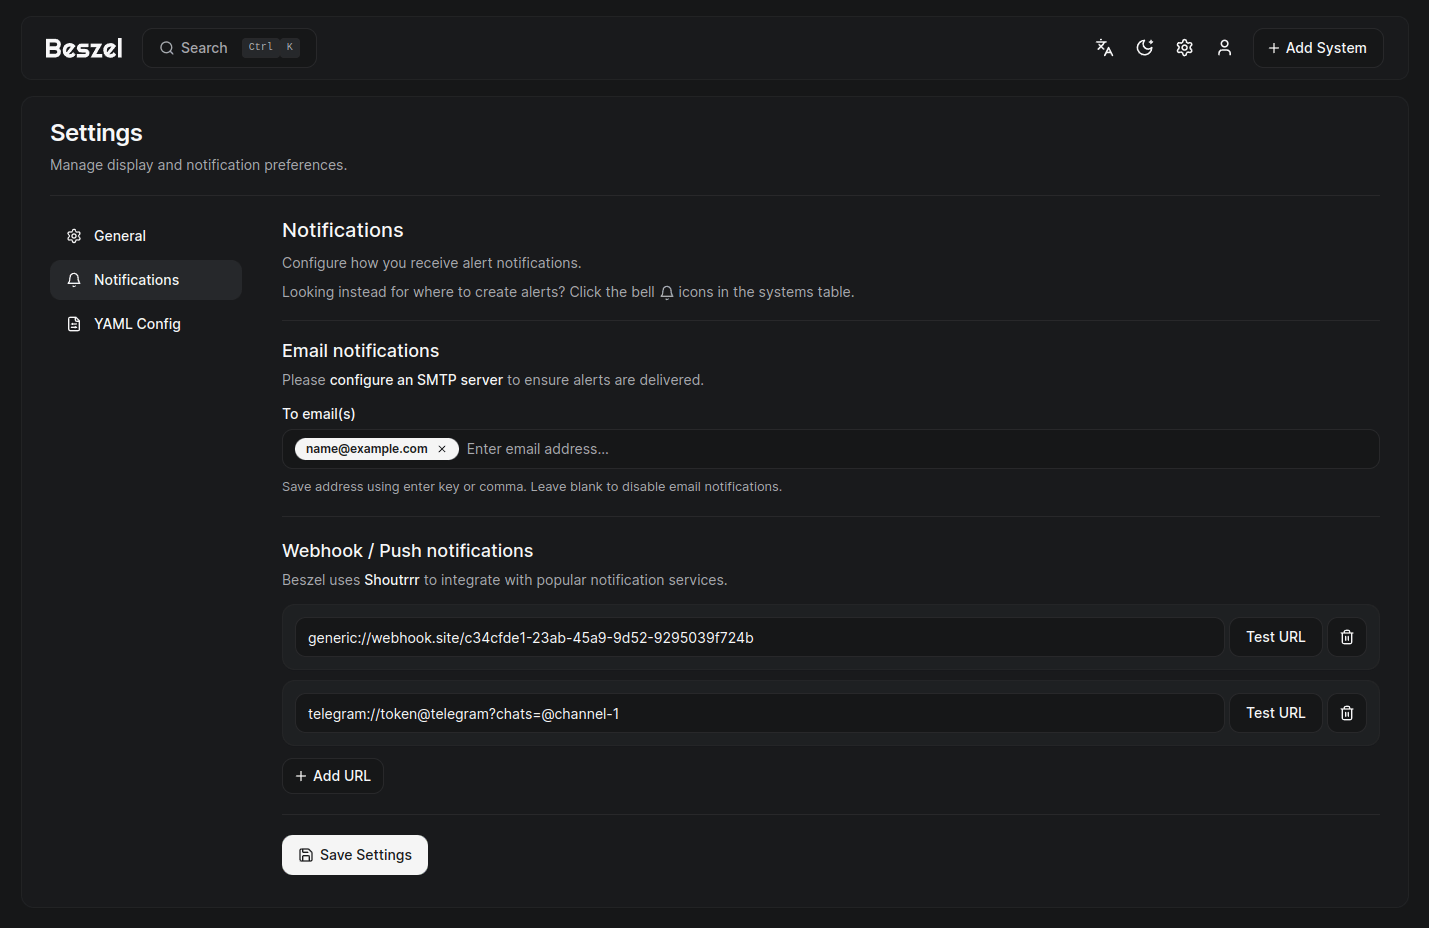
Supported metrics
- CPU usage - Host system and Docker / Podman containers.
- Memory usage - Host system and containers. Includes swap and ZFS ARC.
- Disk usage - Host system. Supports multiple partitions and devices.
- Disk I/O - Host system. Supports multiple partitions and devices.
- Network usage - Host system and containers.
- Load average - Host system.
- Temperature - Host system sensors.
- Fan speed - Host system sensors (Linux, via
/sys/class/hwmon). - GPU usage / power draw - Nvidia, AMD, and Intel.
- Battery charge - Host system and some peripherals.
- Containers - Status and metrics of all running Docker / Podman containers.
- S.M.A.R.T. - Host system disk health (includes eMMC wear/EOL and Linux mdraid array health via sysfs when available).
- ZFS - Pool capacity, usage, health, I/O throughput, scrub status, and per-dataset usage.
- Network monitors - ICMP, TCP, HTTP, and DNS response time and packet loss, probed from the agent. See Network Monitoring.